
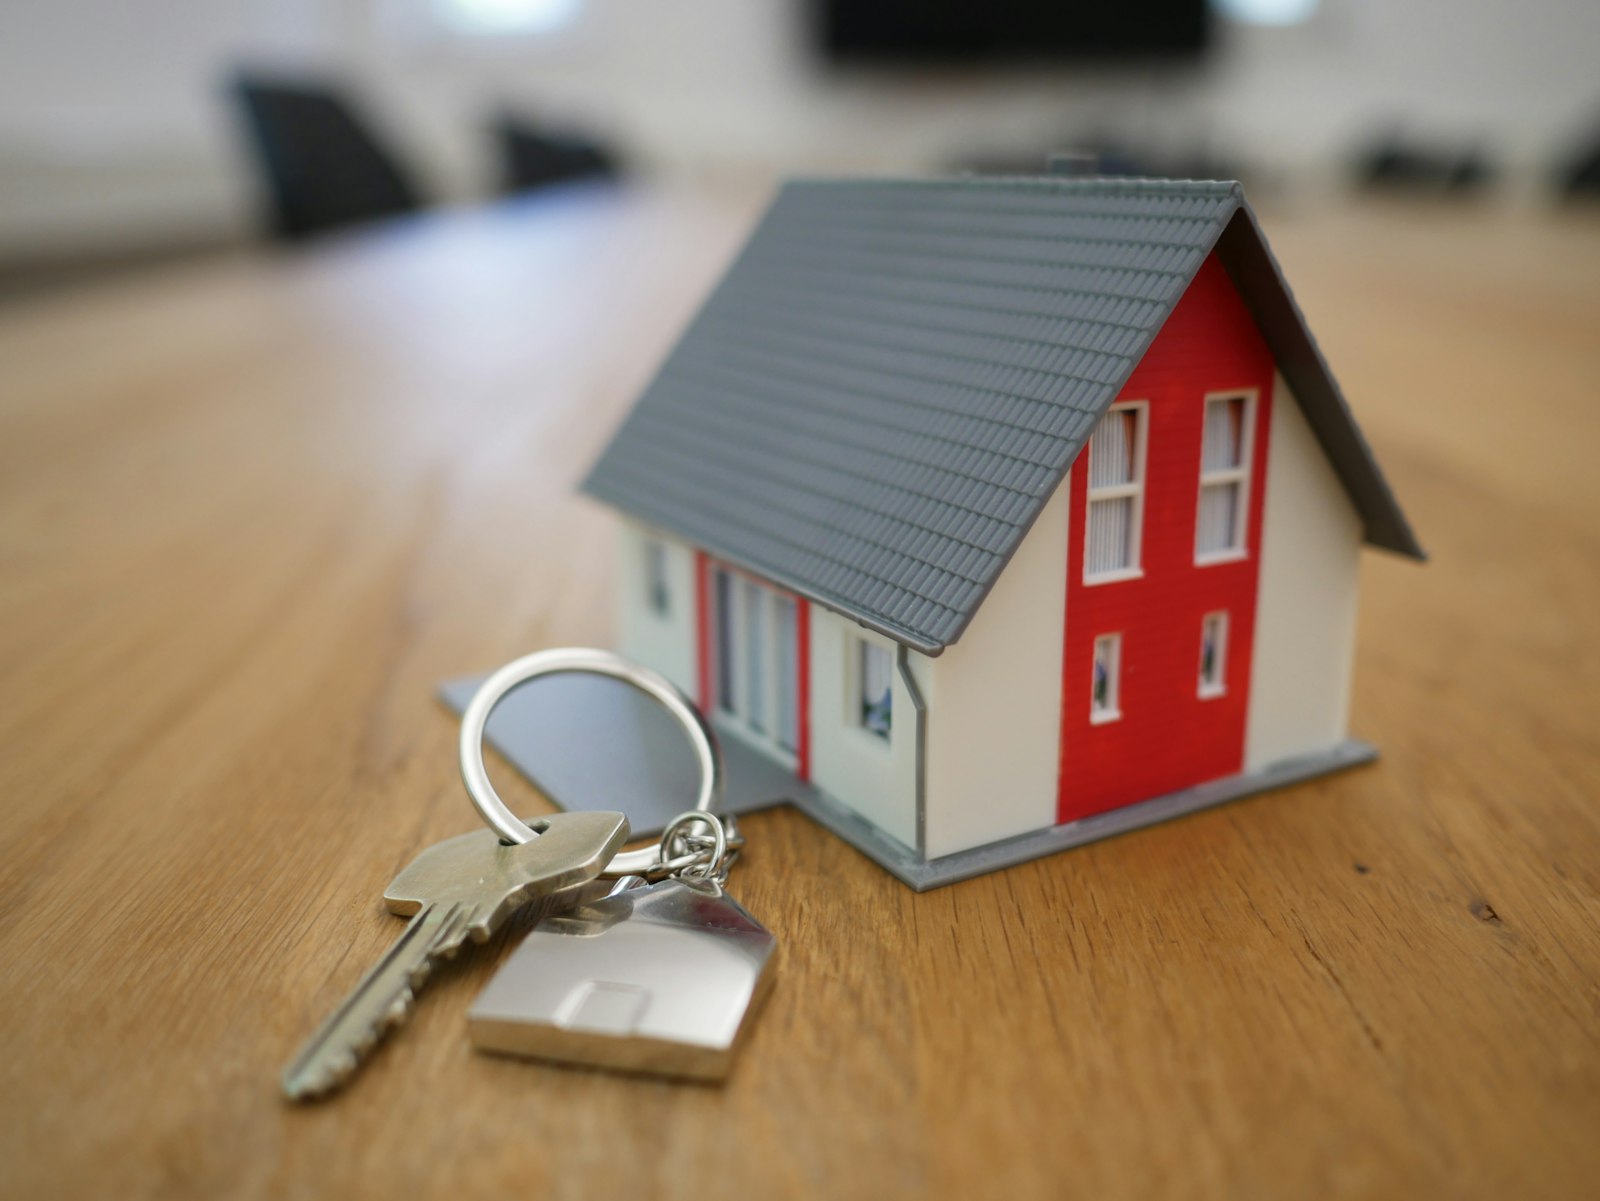
Almost 200,000 households are waiting for public housing. That is families and older people who need a home. Australia has 4 per cent social housing. The average for rich countries is 7 per cent. The government set up a $10 billion fund to fix this. The fund was supposed to build 40,000 homes. So far it has delivered 370. Most of those were already built. The government was not involved in building them. Tax breaks for property investors will cost $247 billion over 10 years. That is more than what is spent on public housing. The property industry donated more than $54 million to political parties over two decades. Neither Labor nor the Coalition has changed the rules. Older women are the fastest growing group facing homelessness. Many worked their whole lives. They cannot afford rent.
190,000 households are on public housing waitlists in Australia. The federal government’s $10 billion Housing Australia Future Fund, established to build 40,000 homes by 2029, had delivered 370 by mid-2025. Most of those were purchases of homes already built by private developers. The government bought them after the fact. (Source: AIHW, Housing Assistance in Australia 2024; news.com.au, September 2025)
Australians have seen this pattern before.
How We Got Here
In 1991, social housing made up 7.1 per cent of all Australian homes. That was not generous. The OECD average was around 7 per cent. Australia was in step with its peers. (Source: AHURI - Australian Housing and Urban Research Institute, July 2022)
Then came a series of decisions, each one reasonable on its own terms, that produced the crisis now measured in hundreds of thousands of households.
In 1999, the Howard Government halved the capital gains tax rate. Investors could now sell a property and pay tax on only half the profit. Combined with negative gearing, a deduction that had existed since the 1930s allowing investors to offset rental losses against other income, property investment became the most tax-effective wealth-building strategy available to anyone who could scrape together a deposit. A Senate Select Committee reported in March 2026 that this interaction “skewed housing ownership away from owner-occupiers.” (Source: Senate Select Committee on the Operation of the CGT Discount, March 2026)
From the 1990s onward, state governments sold off public housing stock. Rural and regional properties went first. What remains is older and in worse condition. In NSW, up to 18,000 public housing properties were transferred to community housing providers on 20-year leases. In Victoria, the state government is still selling off six properties per month that were intended for families at risk of homelessness. South Australia was the only state to achieve a net increase in public housing this century. It added 158 homes. (Source: AHURI Final Report 424, 2024; AHURI, March 2026; realestate.com.au, April 2026)
Federal spending on social housing fell in real terms through the 1990s and 2000s. The National Housing Supply and Affordability Council (NHSAC) said it plainly in 2025: “Australia has underinvested in social and affordable housing for decades.” (Source: NHSAC 2025)
The result was predictable. Social housing fell from 7.1 per cent of all housing in 1991 to 4.1 per cent in 2024. The OECD average stayed at 6 to 7 per cent. Australia is now roughly three percentage points behind comparable countries. That gap represents hundreds of thousands of homes. (Source: AHURI; AIHW, June 2025)
Australia now spends more on tax breaks for property investors than on social housing, homelessness services, and rent assistance combined.
The Numbers Now
Queensland has more than 56,000 people on its social housing register. The list grew 11 per cent in a single year, even after 10,573 people were removed from it. Western Australia’s waitlist reached 20,700. In South Australia, nearly 1,500 public homes sit empty while thousands wait. (Source: QCOSS - Queensland Council of Social Service, April 2026; BCEC - Bankwest Curtin Economics Centre, June 2025; 9 News, October 2025)
The national shortfall, according to housing advocacy group Everybody’s Home, is 640,000 social and affordable homes. (Source: Everybody’s Home, Housing Crisis Snapshot, May 2025)
Only 177,000 homes were built nationally in 2024. The NHSAC says 223,000 were needed. Net overseas migration of 311,000 added further pressure on an already stretched supply. That is more new residents than new homes by a factor of nearly two to one. (Source: ABS; NHSAC 2025)
The Fiscal Comparison
Total government funding for social housing and homelessness services in 2024-25 was approximately $7.7 billion. (Source: Productivity Commission, Report on Government Services 2026)
The capital gains tax discount alone will cost the budget $247 billion in foregone revenue over the next 10 years. That figure comes from the Parliamentary Budget Office. A Per Capita report found that Australia now spends more on tax breaks for property investors than on social housing, homelessness services, and rent assistance combined. (Source: PBO, February 2026; Centre for Equitable Housing/Per Capita, January 2024)
The property industry donated more than $54 million to political parties over two decades, according to the Centre for Public Integrity. Neither Labor nor the Coalition has substantially reformed negative gearing or the CGT discount. Labor took reform to the 2016 and 2019 elections and lost both. (Source: Centre for Public Integrity; AFR, 2019)
Who Is Waiting
Bill Turner is 76. He lives in Perth. He is on the public housing waitlist. He told the ABC he chooses to “live for today” because the future looks so bleak. (Source: ABC News, March 12, 2026)
Older women are the fastest growing homeless cohort in Australia. Many worked their whole lives. Insufficient superannuation. Cannot afford private rents. Approximately 15,600 women aged 55 and over were specialist homelessness services clients. They couch-surf. Sleep in cars. Their homelessness does not make the news. (Source: Mission Australia 2024; Homelessness Australia Facts 2025)
The Salvation Army’s Red Shield Report 2025 found 71 per cent of people seeking help face housing stress. One in three fear homelessness. (Source: Salvation Army, Red Shield Report 2025)
What the Other Side Says
Property investment supporters argue that two-thirds of Australians own their home and rising values are politically popular. Remove negative gearing, they say, and rents go up. The Property Council and Real Estate Institute maintain that investors provide housing governments cannot afford to build.
The Centre for Independent Studies argues CGT reform “would barely move the dial on income and wealth inequality.” Treasury officials have been cautious about major tax changes that could disrupt the housing market.
Construction workforce shortages and materials cost inflation are real constraints, documented by the NHSAC. Even with funding allocated, building takes time. The market-based approach to housing has had bipartisan support since the 1990s. (Source: CIS; AFR, April 2025; NHSAC 2025)
What Has Been Proposed
The AHURI recommends treating social housing as infrastructure with long-term funding pipelines. The Grattan Institute proposes permitting three-storey townhouses and apartments on all residential land in capital cities, which could add up to 67,000 homes per year. The Senate CGT Discount Inquiry recommended reducing the discount from 50 per cent to 33 per cent and phasing out negative gearing for properties beyond a first investment. The Australian Council of Social Service (ACOSS) recommends redirecting that revenue into building public and affordable housing. (Source: AHURI, January 2026; Grattan Institute, November 2025; Senate Select Committee, March 2026; ACOSS, March 2025)
Homelessness NSW wants 10,000 new social homes per year until social housing reaches 10 per cent of all stock. Independent Senator David Pocock calls the 640,000-home shortfall a problem that demands post-war-scale nation-building. (Source: Homelessness NSW; David Pocock, 2025)
The historical record is clear. In 1991, Australia had 7.1 per cent social housing. A capital gains tax discount in 1999, combined with the steady sell-off of public stock and a generation of federal underinvestment, produced the gap that 190,000 households are now waiting in. The documents are public. The numbers are published. The pattern is not hidden.
Sources
- AIHW, Housing Assistance in Australia 2024
- Productivity Commission, Report on Government Services 2026
- AHURI, What is the right level of social housing
- PBO CGT Costing
- Senate CGT Discount Inquiry
- Grattan Institute, More Homes Better Cities
- Everybody’s Home Snapshot 2025
- ABC News, Perth pensioner
- Homelessness Australia Facts
- Guardian Australia waitlist data
Related Investigations
Public Cost, Private Profit / Political Capture
$34 Billion a Year: What Australians Pay in Super Fees
Australians pay $34 billion a year in super fees. More than the Age Pension costs. A 0.5 per cent fee difference can cost a worker $200,000 over their career.
Record Margins, Record Prices, Taxpayer Backing
Australia's two remaining refineries quadrupled their margins in twelve months while consumers paid record fuel prices. The government responded by underwriting private fuel imports with public money. Then, on the same day it announced 200 million litres of extra diesel, it told 160,000 disabled Australians their support was ending.

The $10.8 Billion Rebate
The Fuel Tax Credit Scheme hands back $10.8 billion a year to companies that burn diesel off-road. Mining takes roughly half. The cumulative bill is $122.7 billion. That is more than the Australian Army costs. One Rio Tinto executive lobbied the Treasurer personally to keep it. Eighty-six per cent of Australian mining is foreign-owned. The rebate flows to shareholders overseas. Australians pay foreign companies to dig up their own dirt.